Position: Data Engineer
Program: Diploma in Data Science & Machine Learning
Position: Graduate Teaching & Research Assistant
Program: Master of Applied Statistics & Operations Research with a Business Analytics Specialization
Position: Financial Data Analyst
Position: Business Analyst Intern
Program: Bachelor Science in Finance

Performed queueing analysis on customer arrival, service, and waiting times at a Dunkin' Donuts drive-thru. Collected and analyzed data for 54 customers during peak morning period. Explored distribution fits.
Skills:
Designed and analyzed an ANOVA experiment evaluating the effect of game sound on Mario Kart race times. Checked model assumptions, performed ANOVA, and generated plots.
Skills:
Performed exploratory analysis on career statistics of major league baseball players. Used visualizations and statistical methods to understand relationships between performance metrics like AtBat, Hits and Salary. Applied data cleaning, transformations, resistant models, binning and rootograms. Uncovered insights into distributions, correlations and deviations from normality
Skills: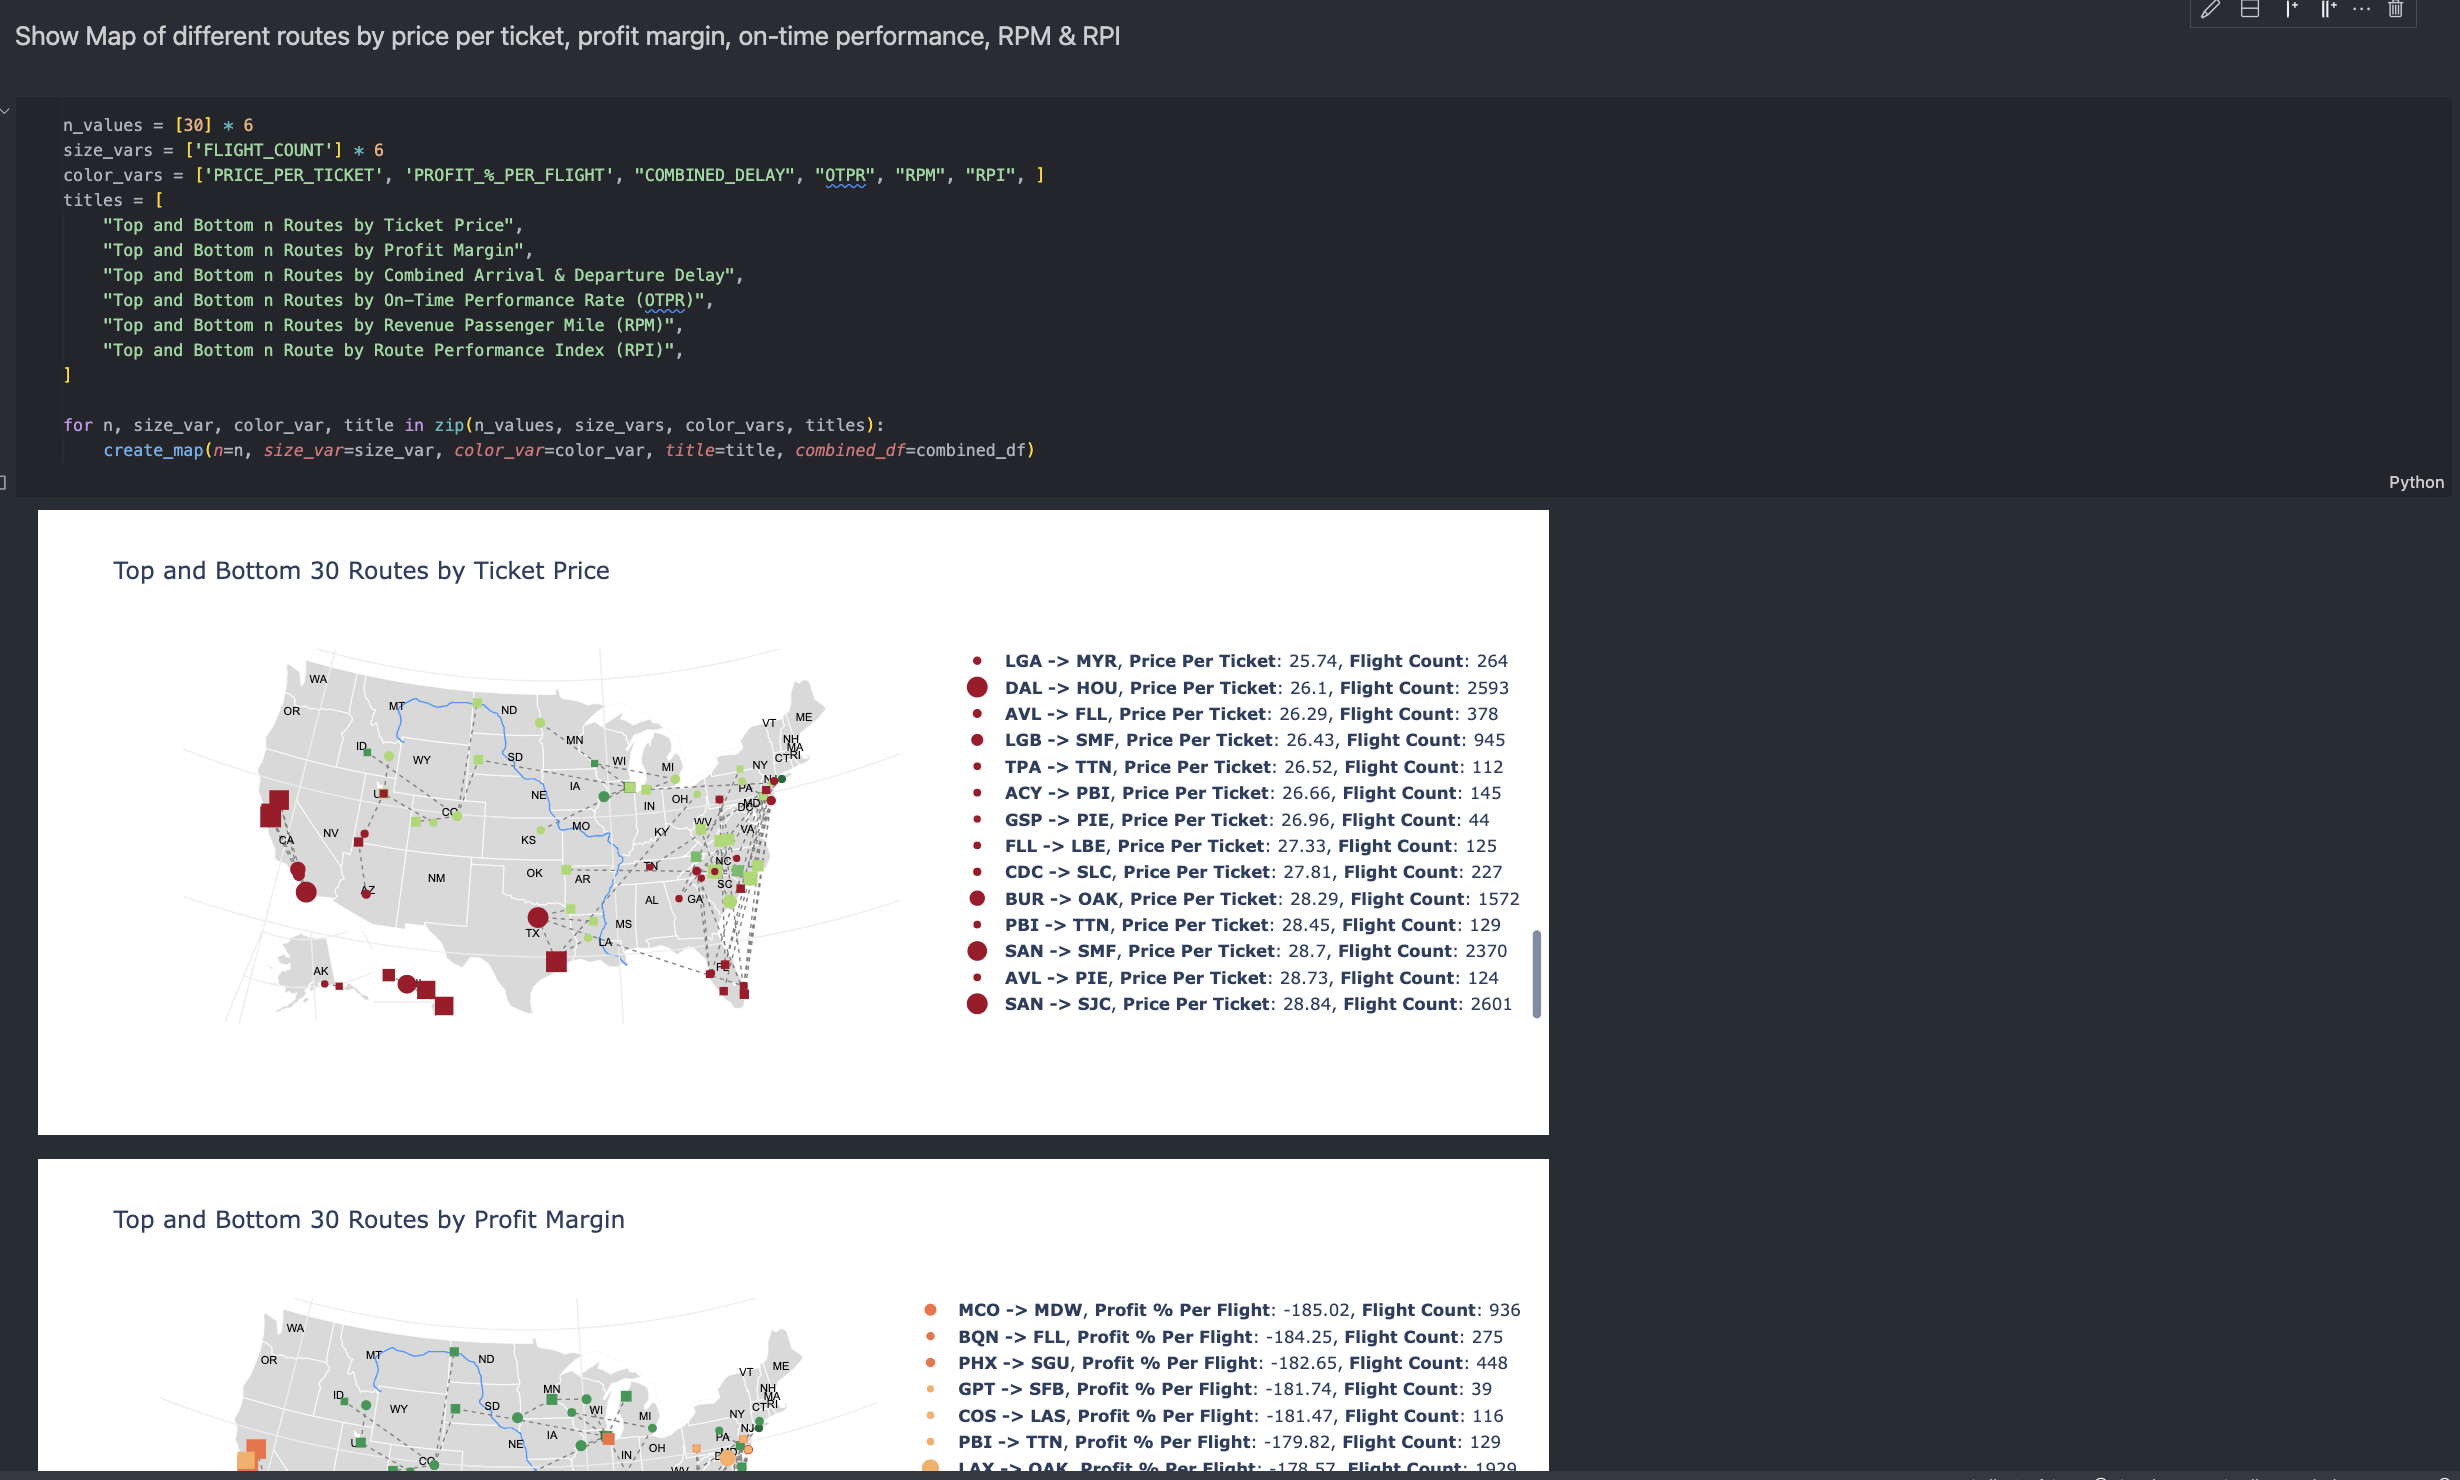
The Airline Route Analysis Project is a comprehensive data analysis and visualization project that focuses on analyzing airline flight route data, calculating costs and revenues, and deriving key performance metrics for various flight route to determine the most suitable for investing
Skills:
Pandas, Python, Matplotlib, Plotly, Jupiter Notebook, Regex
GitHub Repository
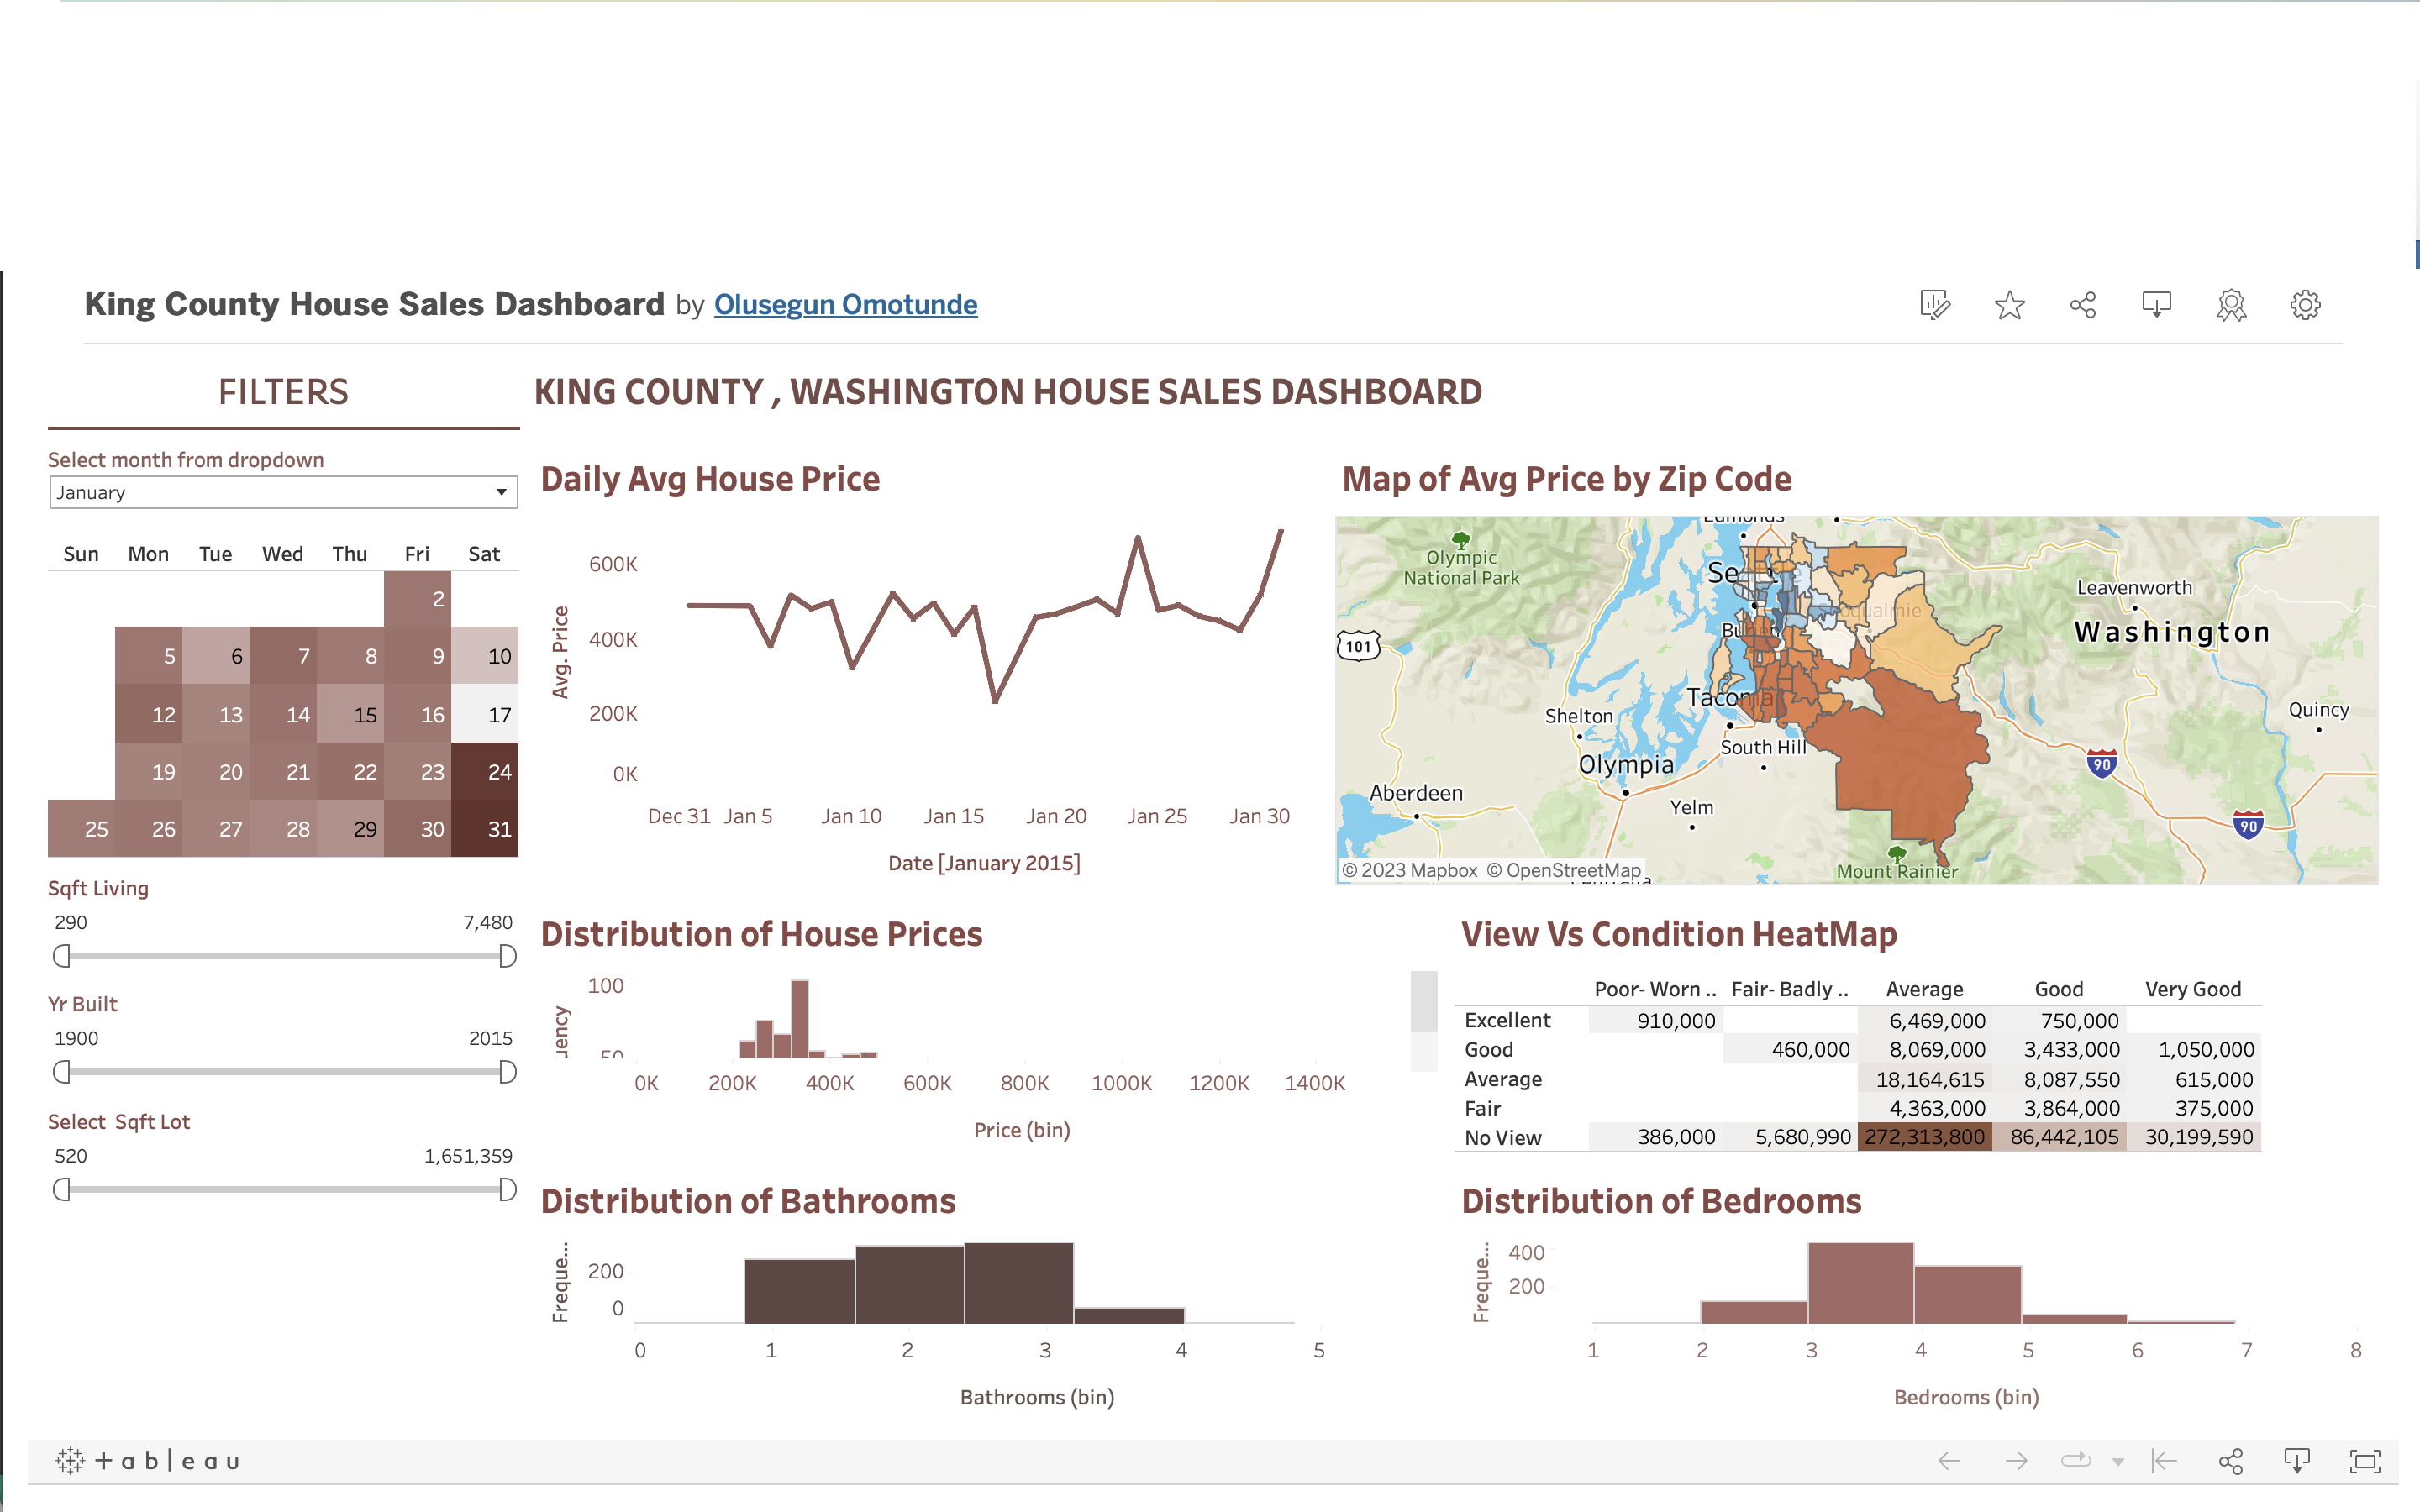
Interactive Tableau dashboard visualizing King County home sales data to deliver insightful market overview. Advanced calculations and filters enable drilling into property details. Visualizes sales trends, pricing, and feature impacts on value. Showcases data storytelling skills through effective charts, maps, parameters, and tooltips
Skills: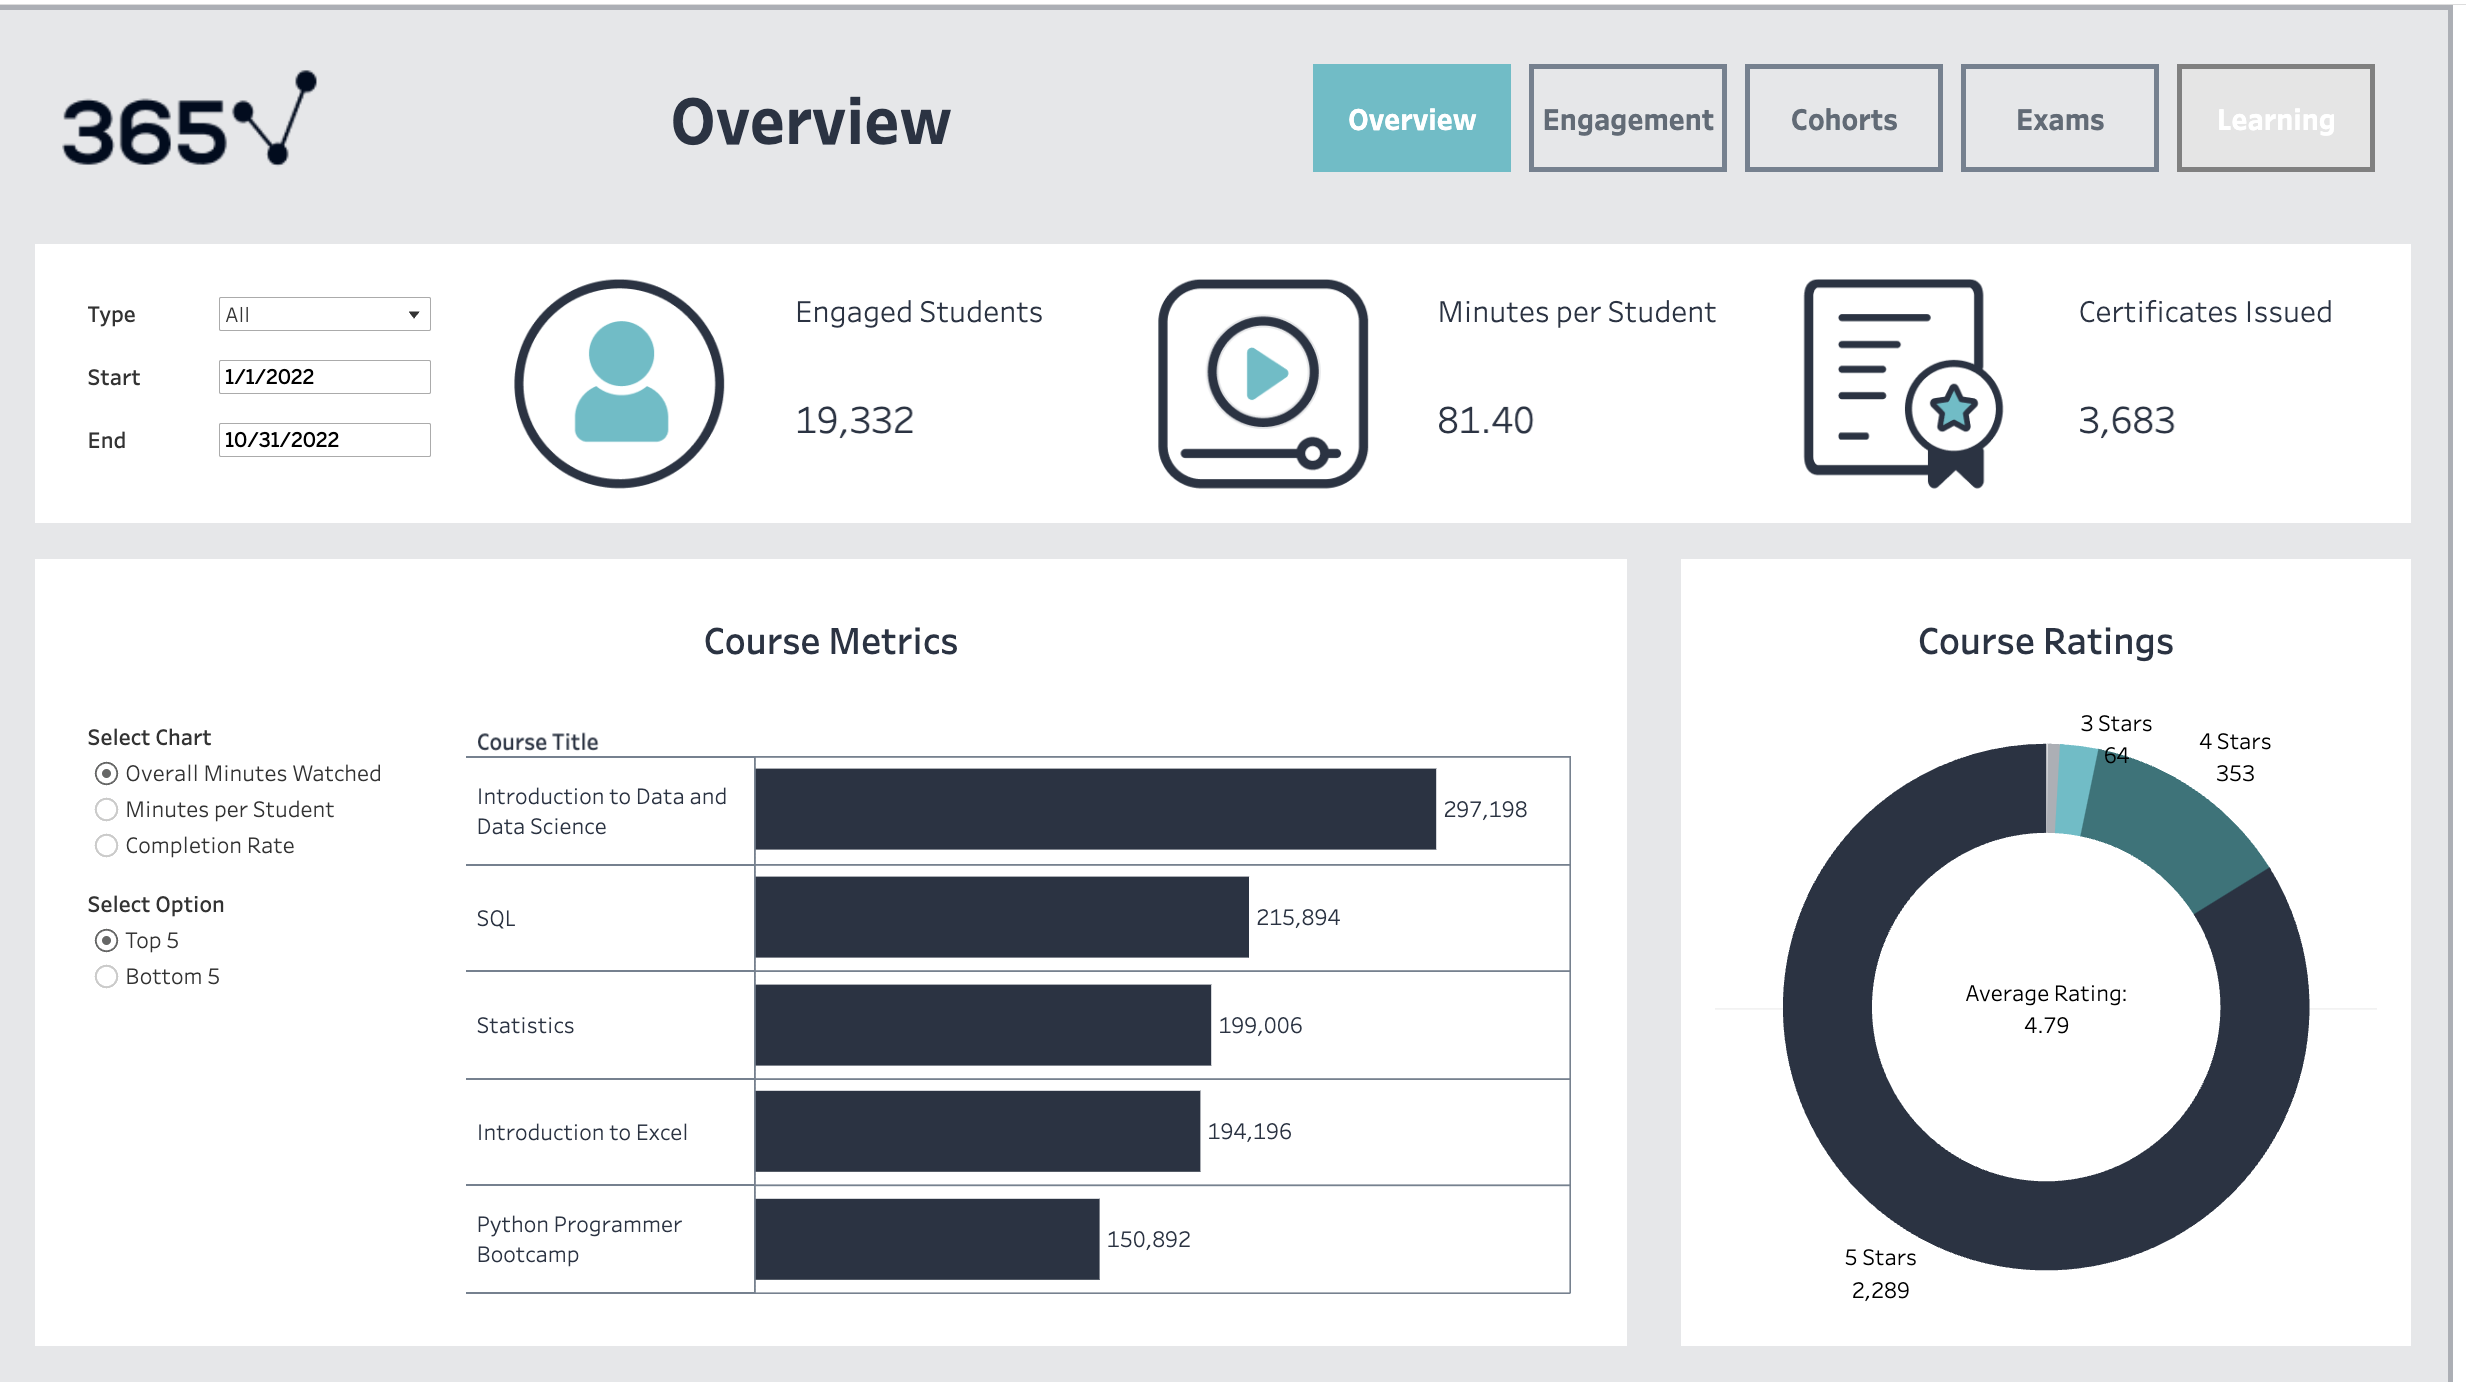
Interactive Tableau dashboard visualizing 365 Careers Customer Behavior to track Cohort Engagement and Customers Metrics.
Skills:
Designed and implemented a relational database using SQL in MariaDB Server and HeidiSQL for a university library system to track books, authors, publishers, students, and employees. Included tables for main entities, constraints, relationships, and sample data
Skills:
Analysis of New York Citi's Bike Program which is responsible for overseeing the largest bike sharing program for 200,000+ data points in the United States through visualization in Tableau
Skills: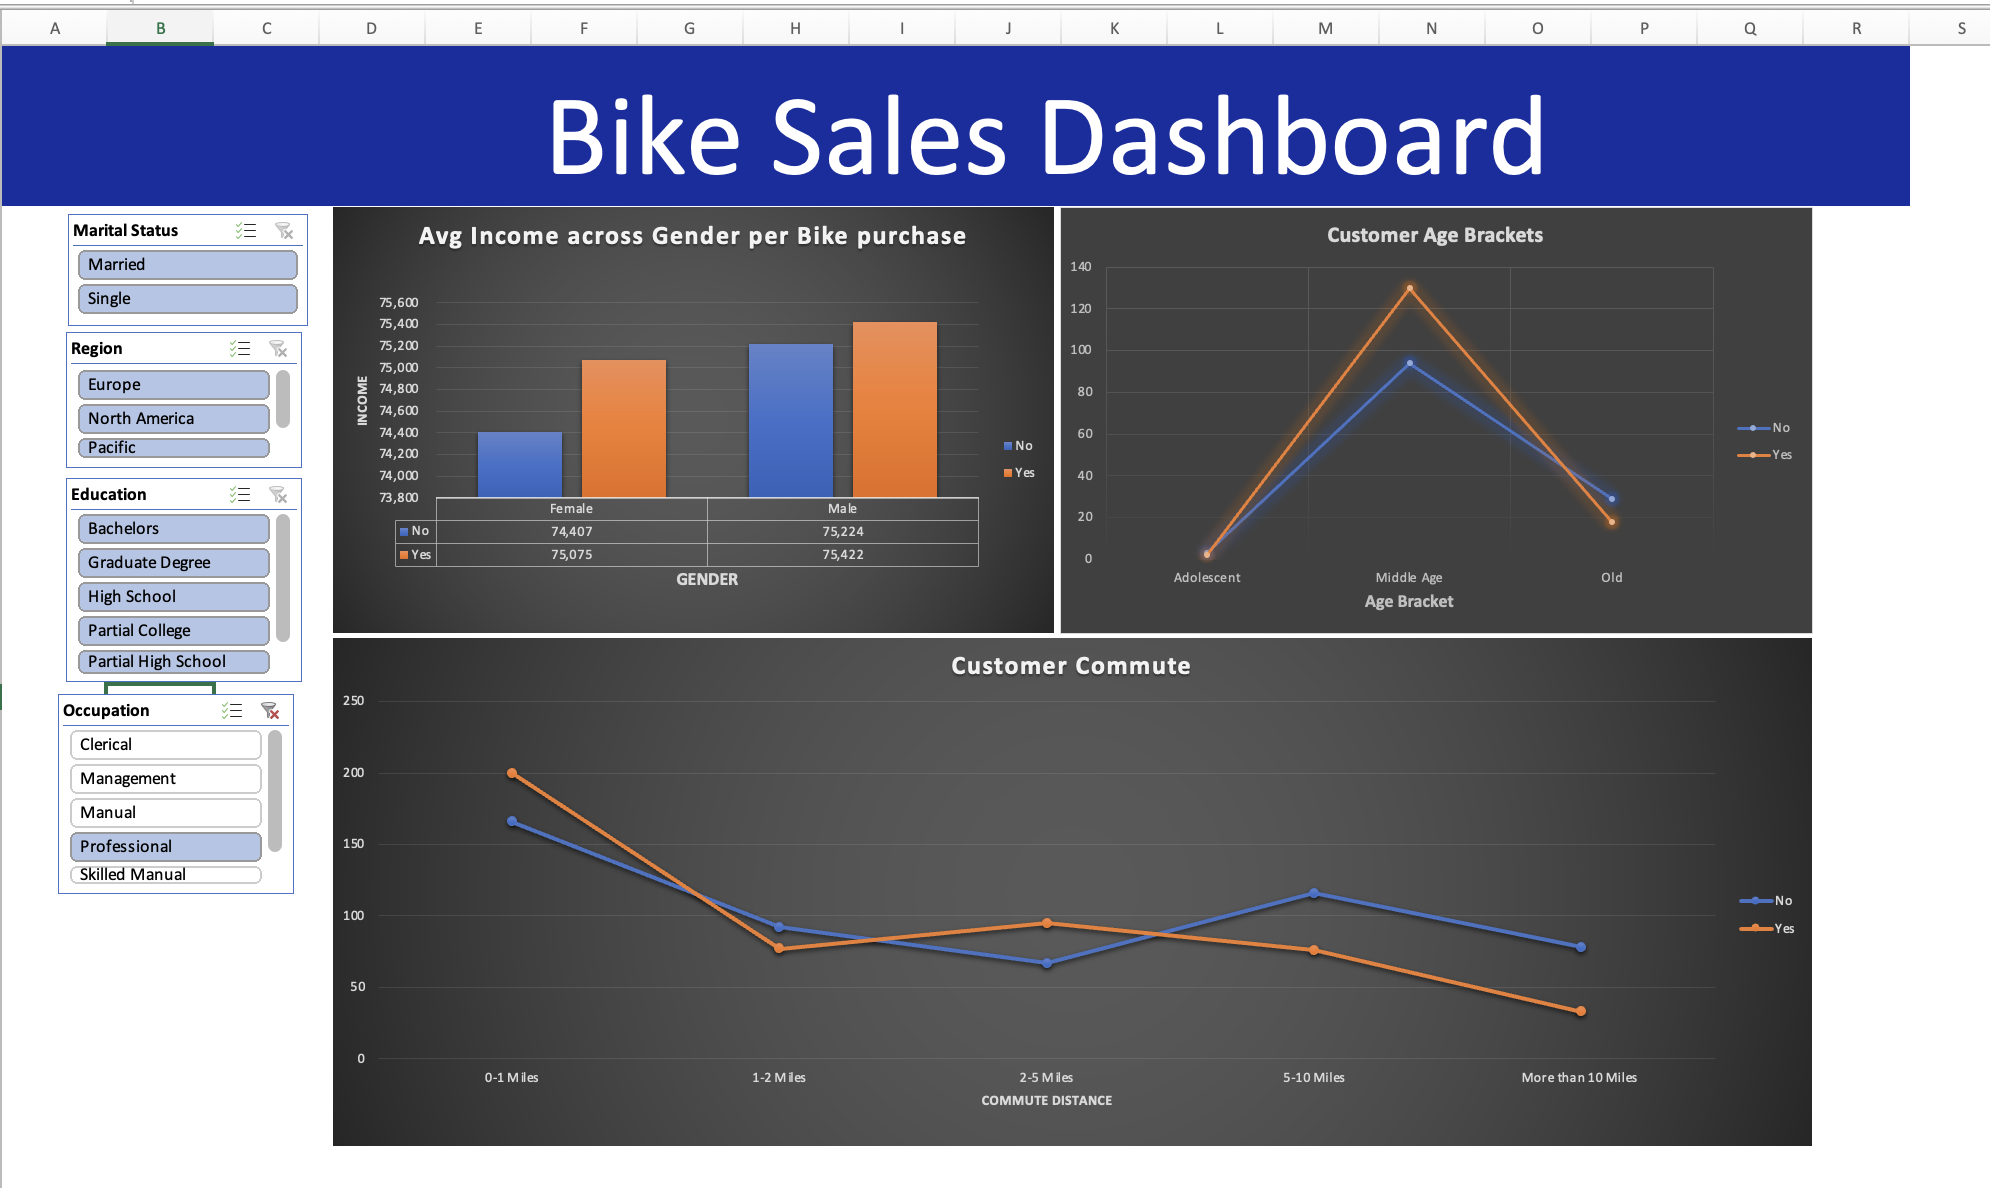
This project analyzes bike sales data to understand purchasing trends and identify opportunities to boost sales. The analysis was performed in Excel using pivot tables, dashboards, and visualizations.
Skills:
This project focuses on leveraging a substantial dataset to extract insights that can aid HR departments in understanding the market's recruitment landscape. The report delves into various insights obtained through detailed Exploratory Data Analysis (EDA) and data cleaning processes. Explore HR Analytics using SQL and Python for dataset creation, cleaning, and EDA. Visualize insights with Python (matplotlib, seaborn) and Tableau. Enhance HR decision-making with comprehensive analysis.
Skills: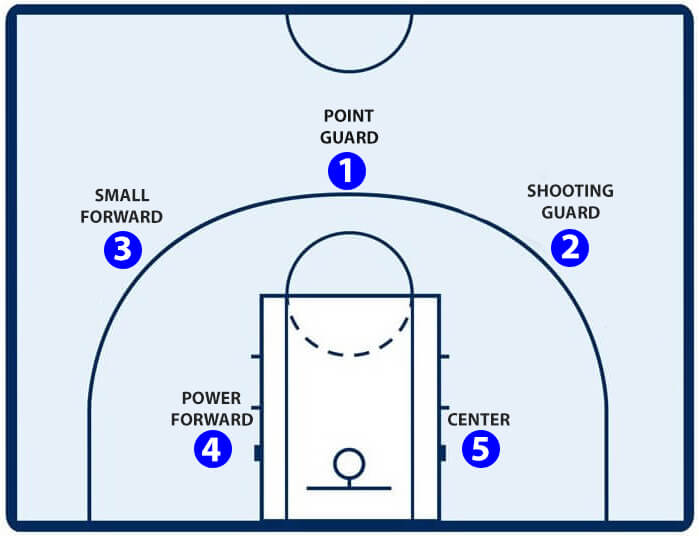
NBA Player Clustering- Performed unsupervised clustering analysis on player stats to categorize NBA players based on style of play and on-court contributions. Analyzed box score data from the 2020-2021 season using K-means, hierarchical, and model-based clustering algorithms. Identified an optimal 3-cluster solution that divides players into groups called "In-the-Paints", "Generals", and "Versatiles" based on statistical profiles
Skills: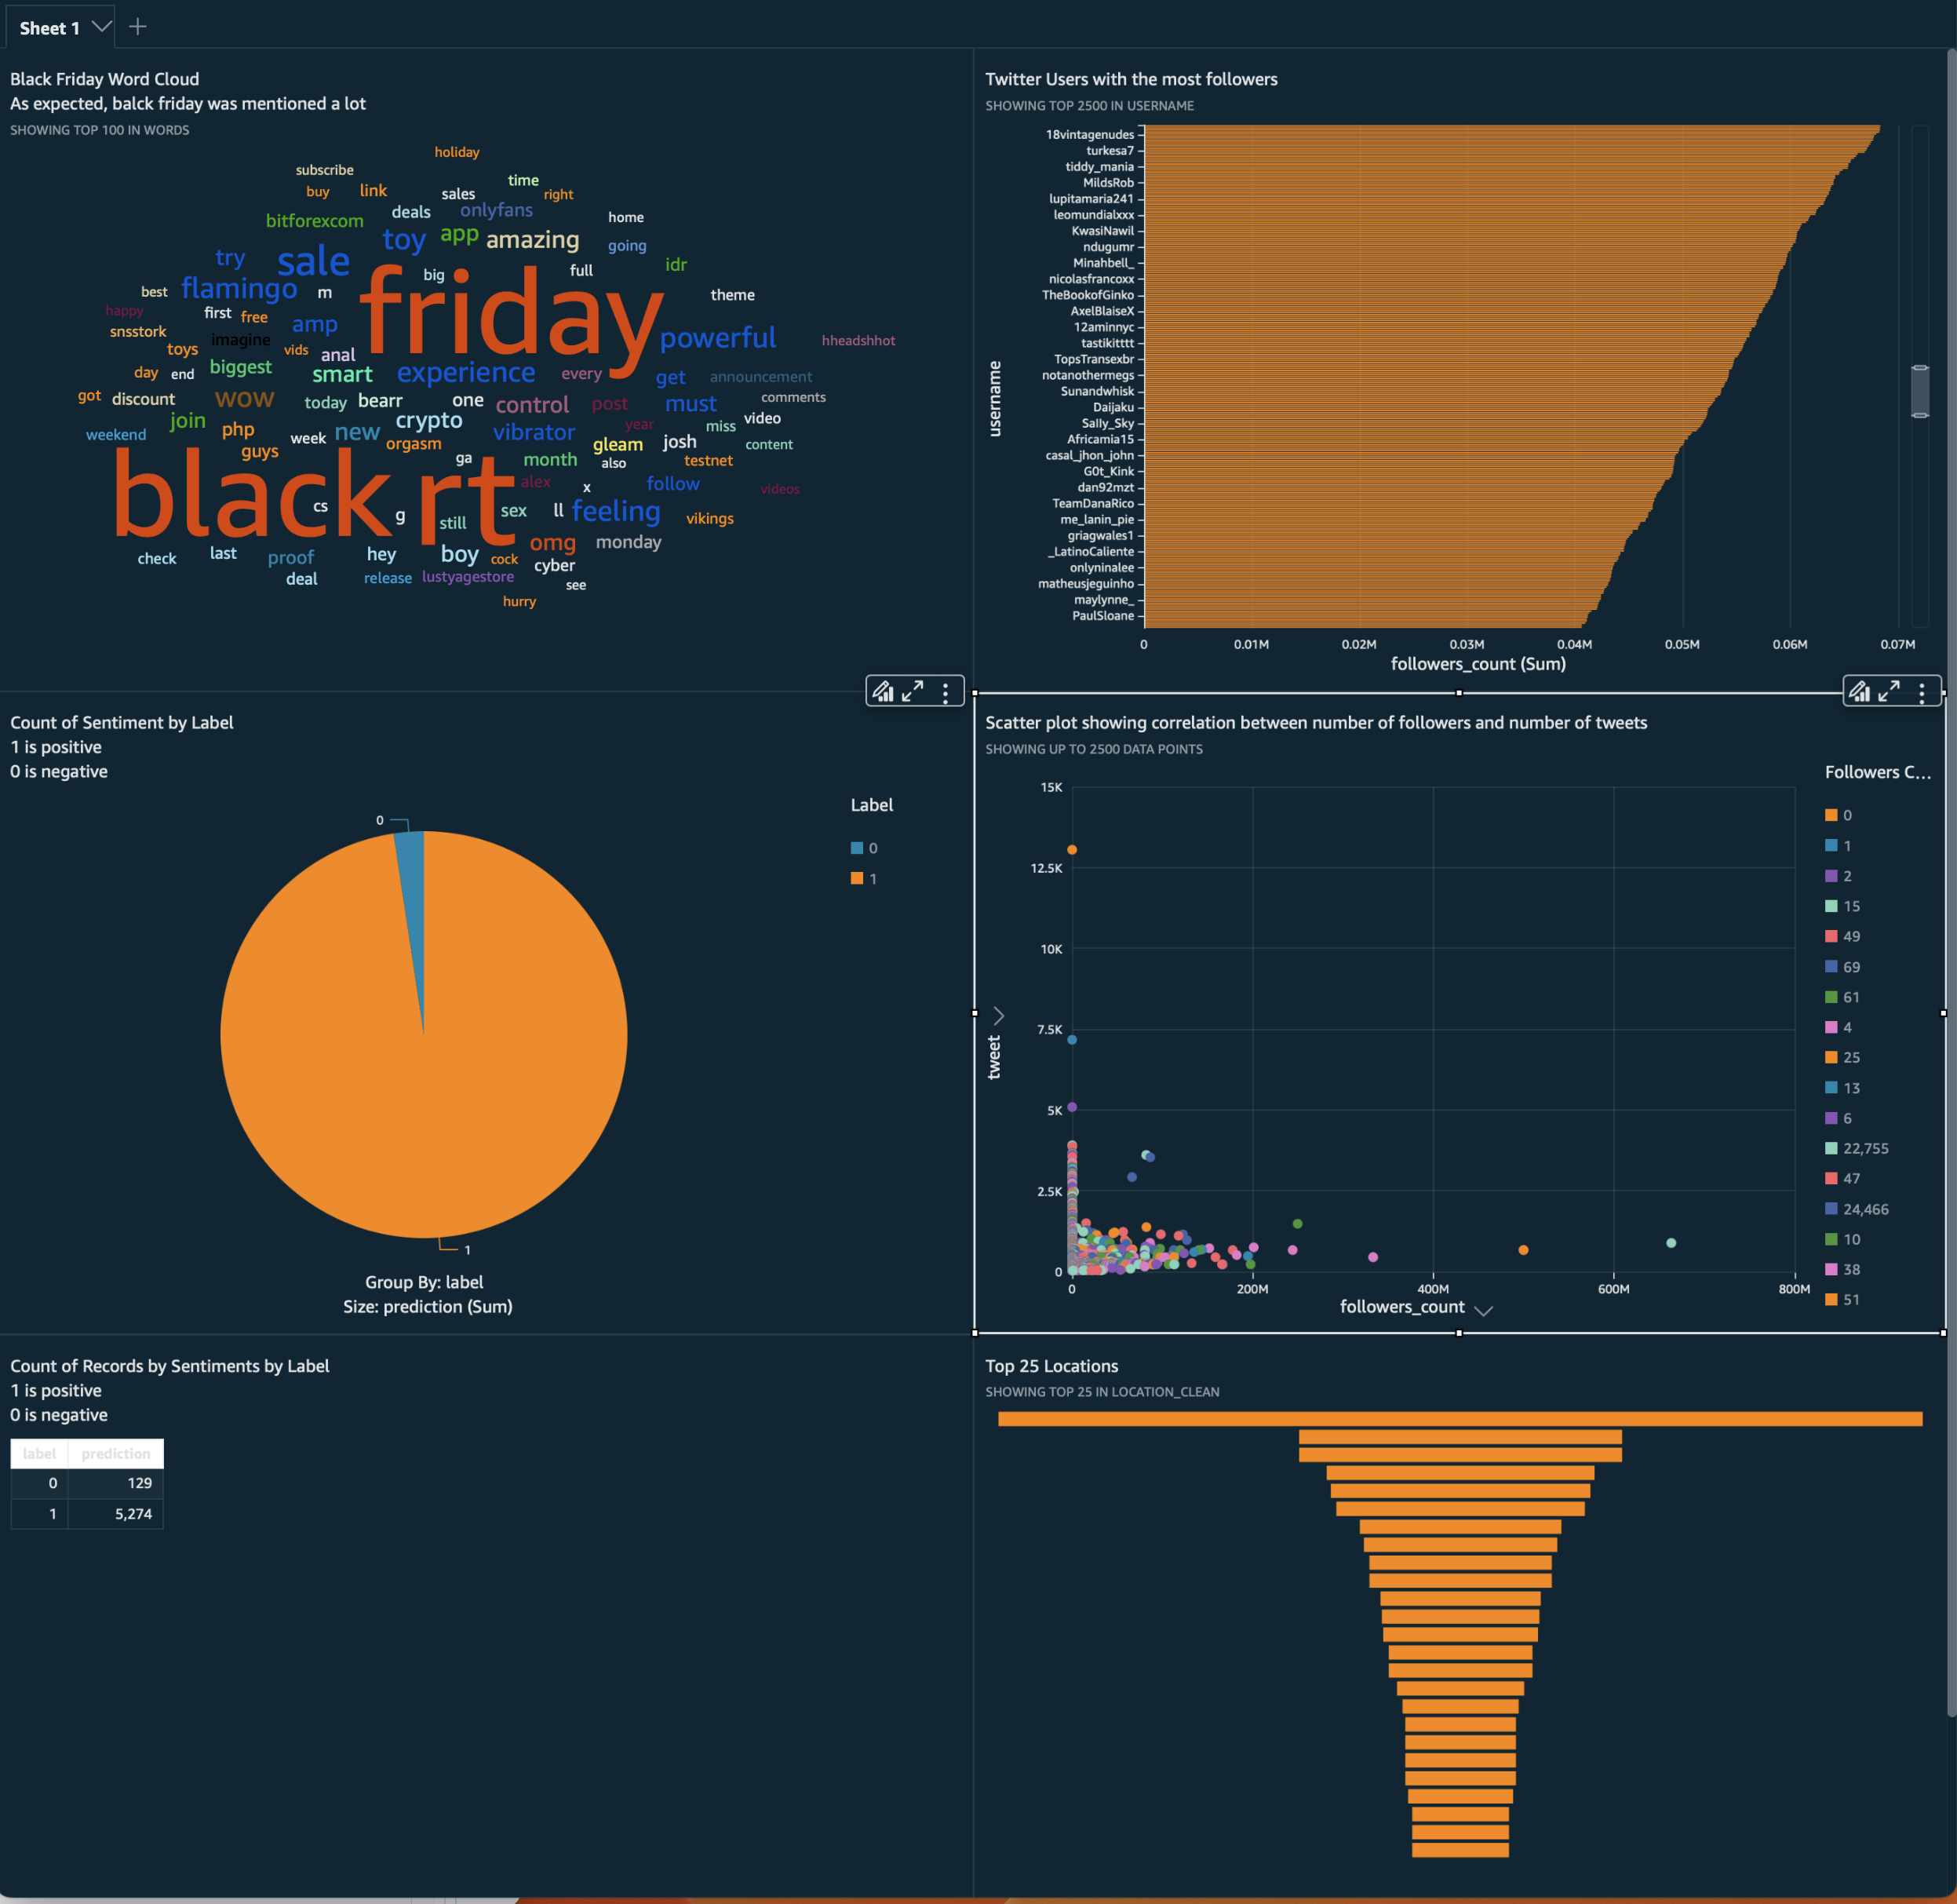
This project focuses on sentiment analysis of tweets related to Black Friday shopping events. The dataset is obtained from the Twitter API, stored in CSV format, and loaded into an Amazon S3 bucket via Amazon Kinesis Data Firehose. A machine learning pipeline is established to train a Logistic Regression model for supervised sentiment analysis. The model's accuracy is then calculated, and the prediction data is written to a personal S3 bucket for further analysis.
Skills:
Developed a regression model using R to predict MLB player salaries based on performance statistics. Selected predictors from a dataset of 263 player-seasons using methods like variable selection, transformations, and influence diagnostics. The final 10 variable model attained an adjusted R-squared of 0.75 and accurately predicted salaries on test data
Skills: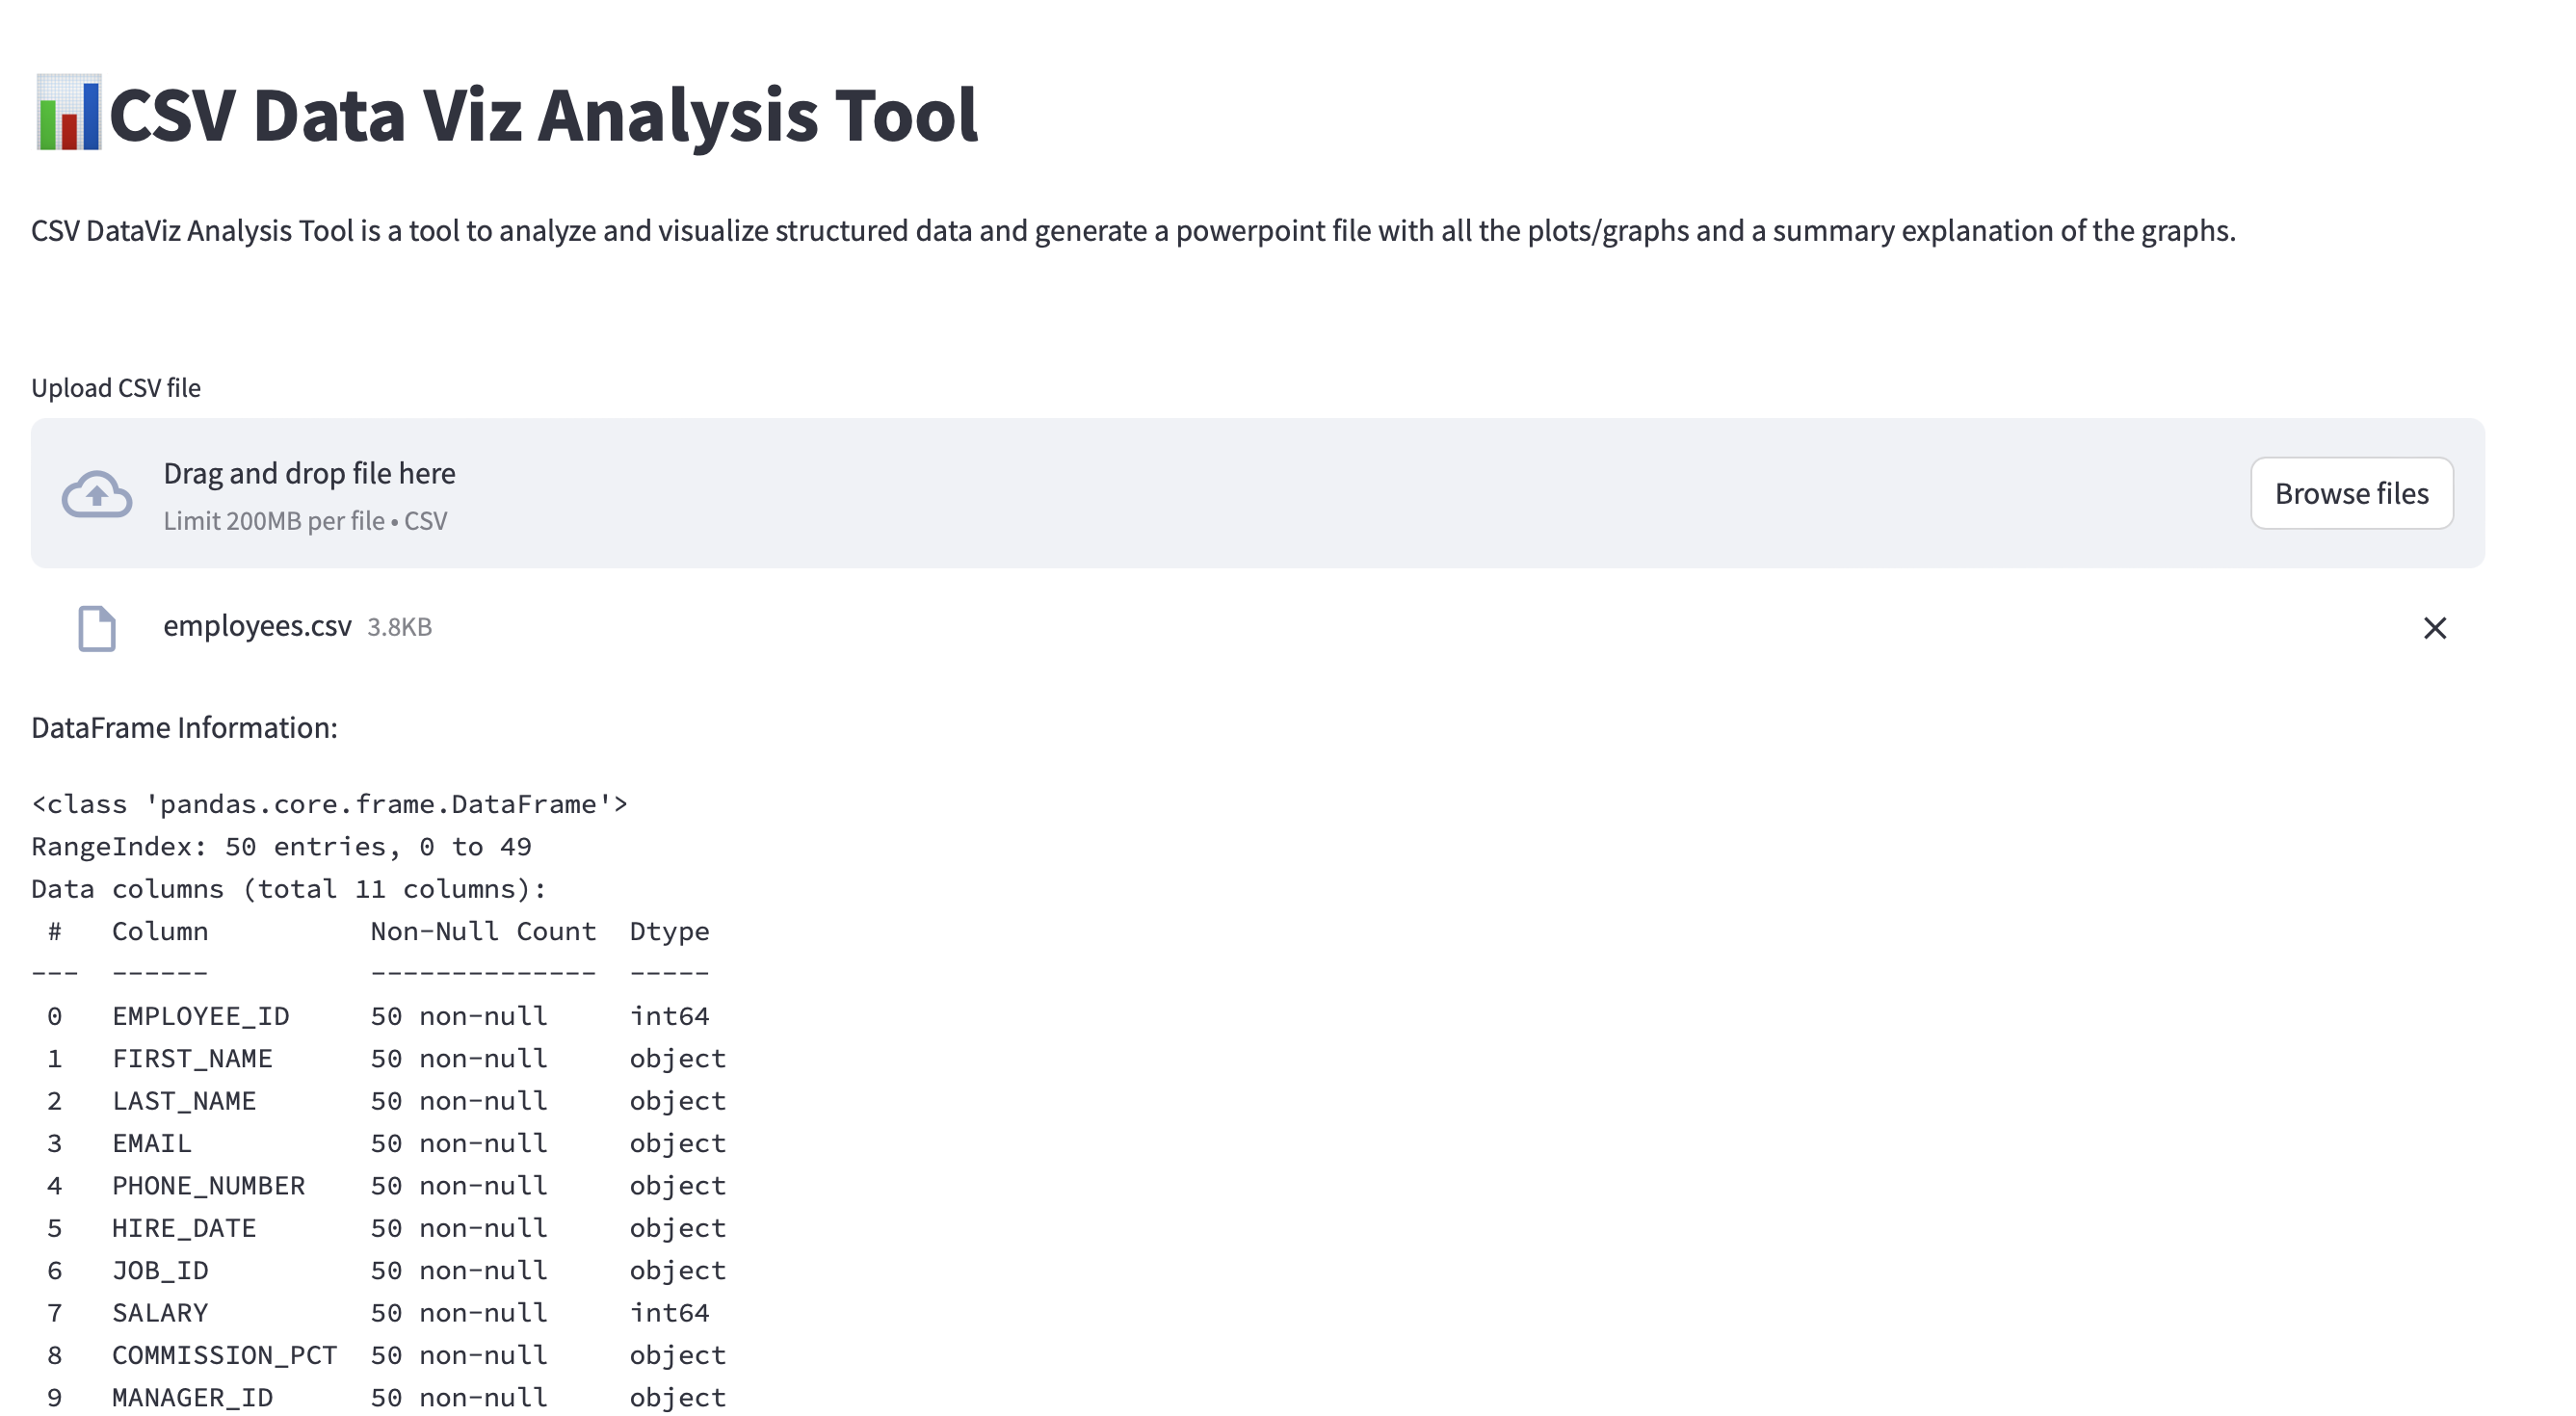
CSV Data Viz Analysis Tool is a user-friendly application designed for visualizing structured data. This tool allows users to effortlessly create plots with accompanying summary explanations and easily embed them in a downloadable PowerPoint file. Powered by advanced language models, the application is tailored for seamless integration with Streamlit
Skills: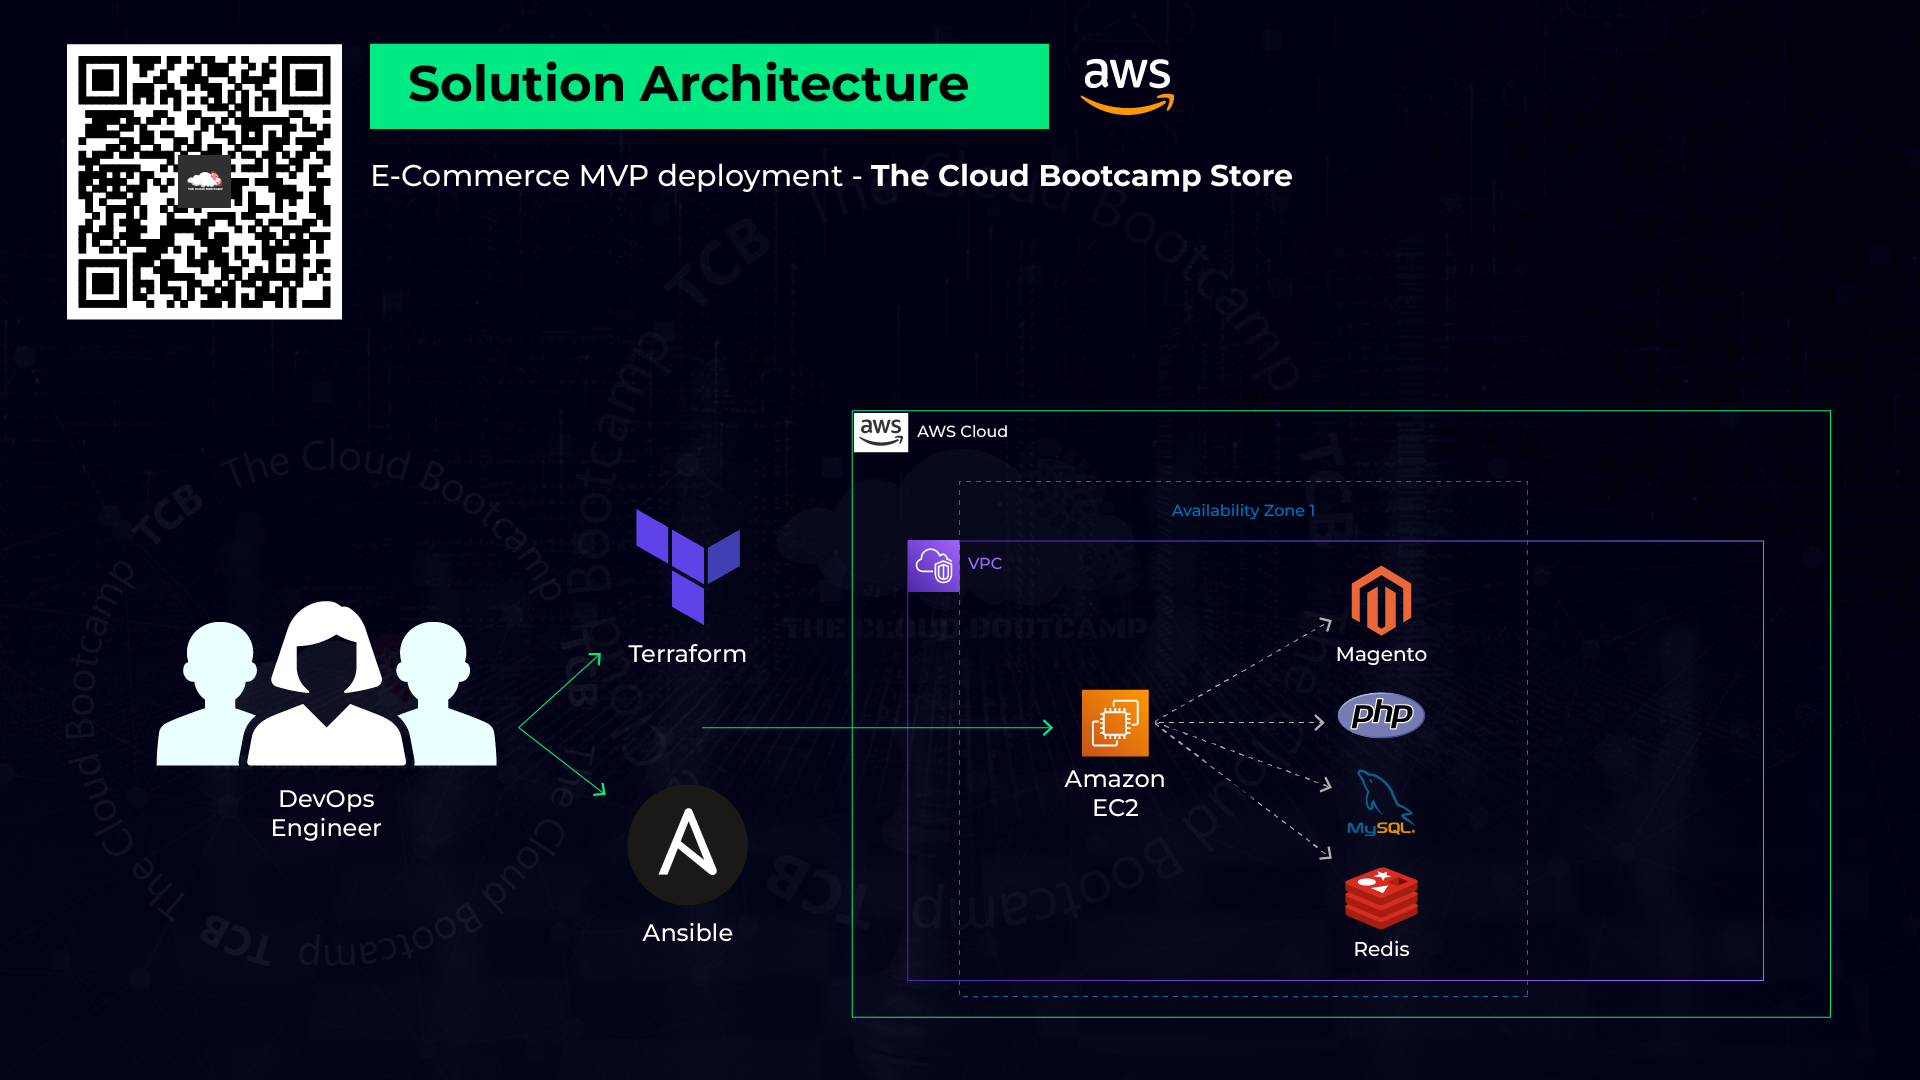
In this project, I worked as a Cloud Engineer using DevOps, where I created and implemented an e-Commerce MVP (Minimum Viable Product) on AWS in less than 2 hours and in an automated way using Terraform and Ansible (Infrastructure as Code — IaC)
Skills:
In this project, I as the Cloud Specialist was responsible for migrating a workload running in a Corporate DataCenter to AWS using the Amazon EC2 and RDS service
Skills: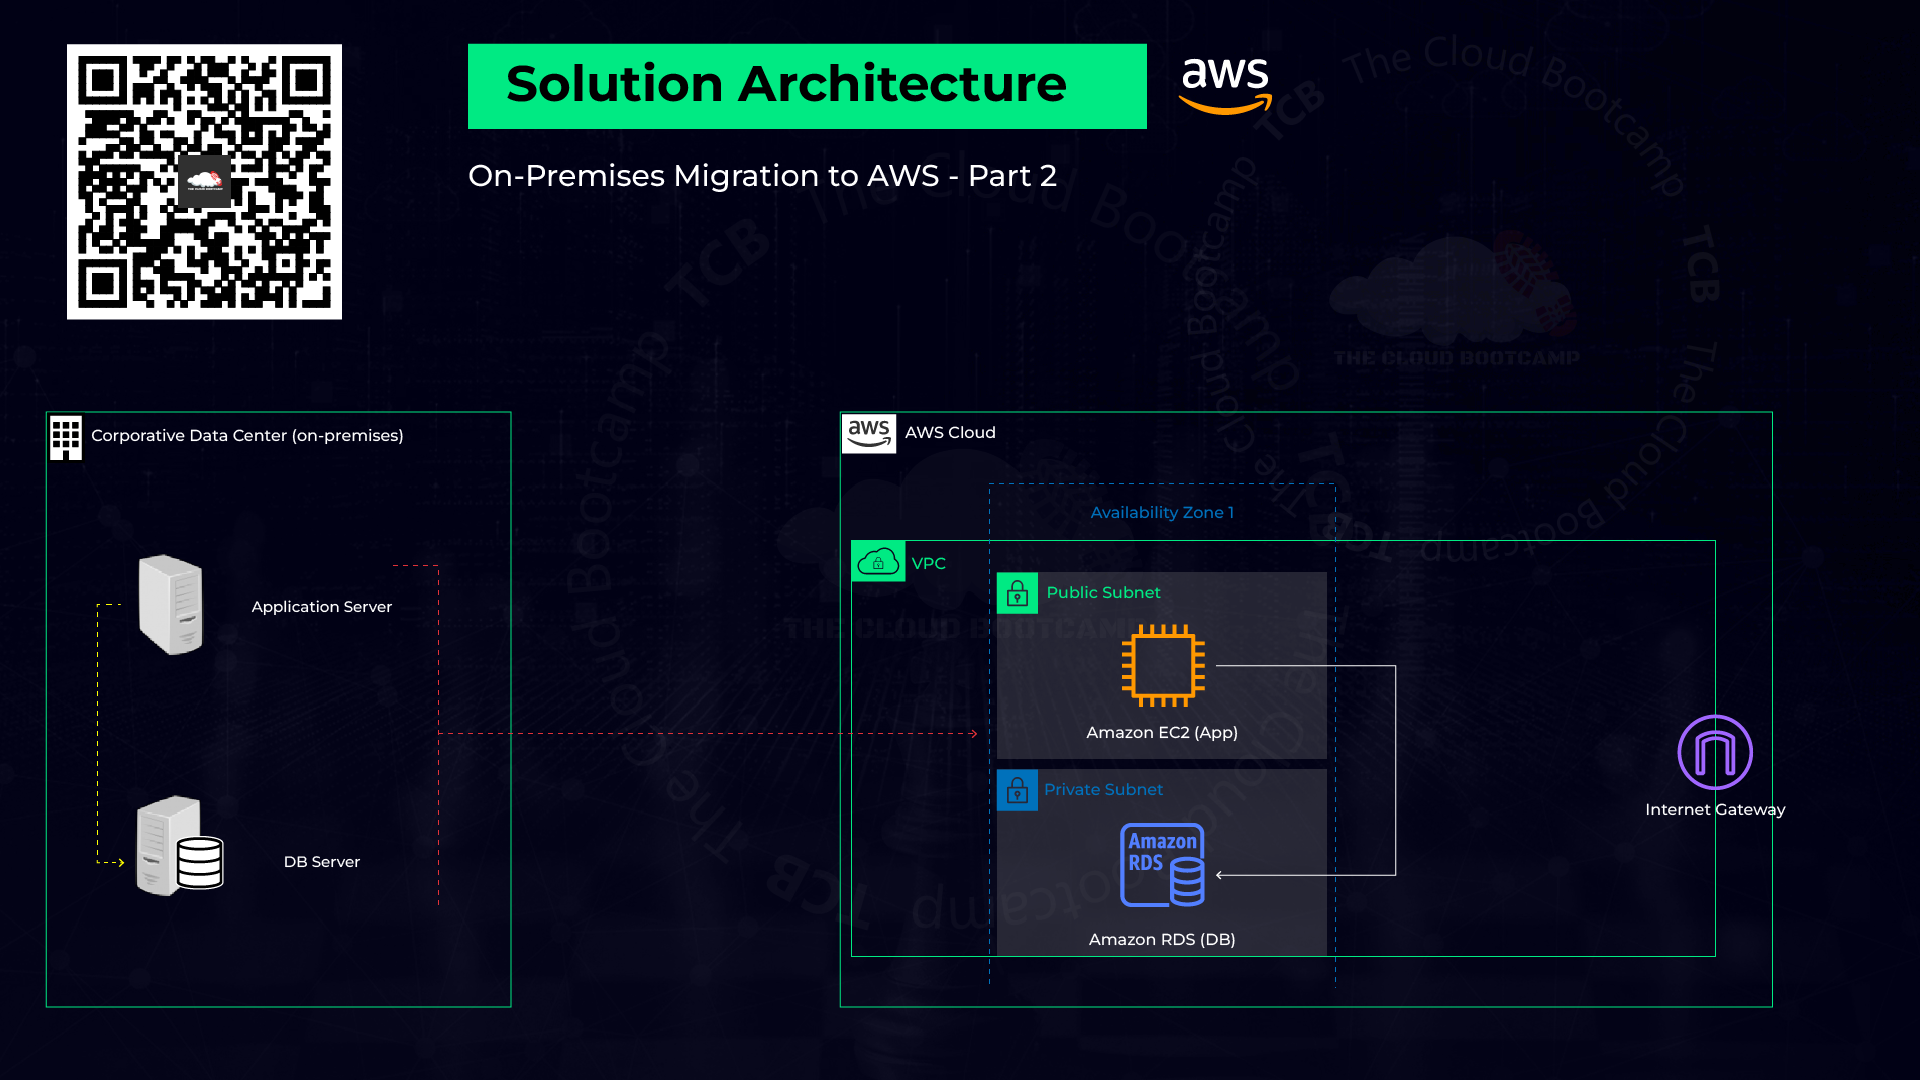
In this project, I was responsible for implementing an application that needs to support the high demand of a large number of users accessing it simultaneously
Skills: